
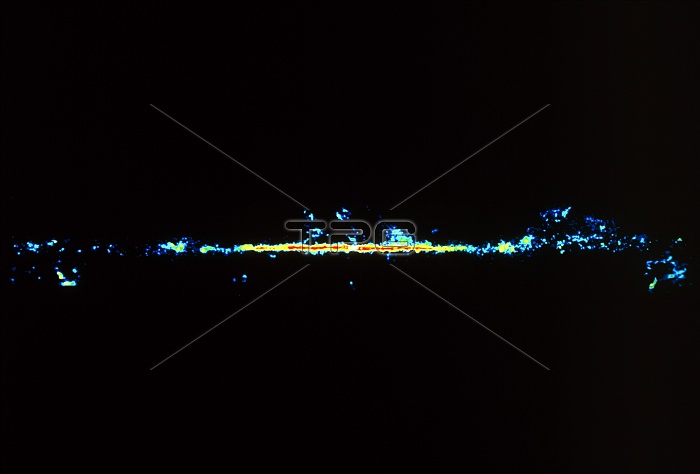
One of two maps showing the distribution of carbon monoxide molecules in our Milky Way galaxy. This map is coded for intensity, from white (highest concentration of carbon monoxide), through yellow and red to blue (lowest concentration). The galactic centre is in the middle of the map. The two maps were made at a wavelength of 2.6mm with twin 1.2-metre radio telescopes, one in New York City, the other in Chile. (See R800/119 for the second map).
| px | px | dpi | = | cm | x | cm | = | MB |
Details
Creative#:
TOP10240785
Source:
達志影像
Authorization Type:
RM
Release Information:
須由TPG 完整授權
Model Release:
N/A
Property Release:
N/A
Right to Privacy:
No
Same folder images:
 Loading