
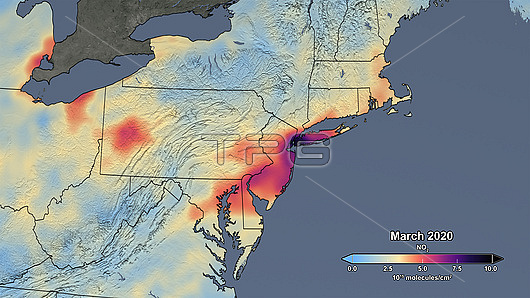
Satellite data map of the nitrogen dioxide (NO2) levels in the northeastern USA for March 2020, during the 2019-20 Covid-19 outbreak. Nitrogen dioxide is a pollutant gas produced during industrial fossil fuel combustion and by road traffic. The shelter-in-place orders to stop the spread of the new coronavirus, SARS-Cov-2, that is the cause of Covid-19 have lead to a reduction in NO2 emissions from both industry and traffic. Data obtained by the Ozone Monitoring Instrument (OMI) on NASA's Aura satellite. See C048/7123 for average NO2 levels in March between 2015-19.
| px | px | dpi | = | cm | x | cm | = | MB |
Details
Creative#:
TOP25657346
Source:
達志影像
Authorization Type:
RM
Release Information:
須由TPG 完整授權
Model Release:
N/A
Property Release:
N/A
Right to Privacy:
No
Same folder images:
2000s2020s202021stcenturyamericanatmosphereatmosphericauracolouredearthearthobservationearthscienceenvironmentenvironmentalsciencefalse-colouredfossilfuelcombustionfromspacegaskeymapmarchmonthnewyorkcitynitrogendioxideno-oneno2nobodynortheastnortheasternomiozonemonitoringinstrumentpollutantpollutionsatelliteunitedstatesusacoronaviruscoronaviruscovid-19outbreaklockdownshelter-in-placeepidemicpandemichcov2019-ncovdiseasenovelcoronavirusviralvirusdisordercondition
2000s2019-ncov20202020s21stamericanatmosphereatmosphericauracenturycitycolouredcombustionconditioncoronacoronaviruscoronaviruscovid-19dioxidediseasedisorderearthearthearthenvironmentenvironmentalepidemicfalse-colouredfossilfromfuelgashcovinstrumentkeylockdownmapmarchmonitoringmonthnewnitrogenno-oneno2nobodynortheastnortheasternnovelobservationomioutbreakozonepandemicpollutantpollutionsatellitesciencescienceshelter-in-placespacestatesunitedusaviralvirusvirusyork
 Loading